My 3rd grader's class is doing money, fractions, and probability, and I've been thinking up a brief parent volunteer lesson plan to talk about probability with dice, around the idea of having two people each roll a die with a different number of sides, and talking about how likely it is that one or the other roll the higher number.
I'd start with d4 vs. d6; there are 24 possibilities and it's easy enough to work with the kids to enumerate all of them. There are 14 wins for the d6, 6 for the d4, and 4 ties.
d6 vs. d8 is tougher to do in a short lesson; we'll work out that there are 48 possible outcomes, and there are 6 ties in those outcomes. Maybe we'll have time to work out that the number of wins for the d6 is 1+2+3+4+5, or the sum of number from 1 to (number of sides-1), and therefore the number of wins for d8 is 48 - 6 - 15 = 27, but that's probably too much to get through in a single day.
So we're all set, except... in d4 vs. d6, 14 - 6 = 8 = 2 * 4; in d6 vs. d8, 27 - 15 = 12 = 2 * 6. Hunh.
Dice Larger Smaller Ties
Wins Wins
d4 vs. d6 14 6 4
d6 vs. d8 27 15 6
d8 vs. d10 44 28 8
d10 vs. d12 65 45 10
d12 vs. d20 162 66 12
The difference in the number of wins is the number of sides on the smaller die times the difference in the size of the dice. I'd never noticed this before. Cool.
The visual explanation for this relationship is as follows (looking at the possible outcomes of d4 vs. d6):
1,1 2,1 3,1 4,1
1,2 2,2 3,2 4,2
1,3 2,3 3,3 4,3
1,4 2,4 3,4 4,4
1,5 2,5 3,5 4,5
1,6 2,6 3,6 4,6
The red area above the diagonal shows where the smaller die wins, the blue on the diagonal shows the ties, and the green below the diagonal shows where the larger die wins. In the first four rows, the numbers of wins are balanced, but once past the possibility of a tie, the larger die wins every possible outcome in the row. The number of outcomes in each row is the size of the smaller die, and the number of rows in which the the larger die wins all possible outcomes is the difference in the sizes of the dice.
Ah, of course. It looks obvious from this angle, but wasn't immediately so coming at it from the other side.
Showing posts with label math. Show all posts
Showing posts with label math. Show all posts
Tuesday, April 23, 2013
Sunday, November 4, 2012
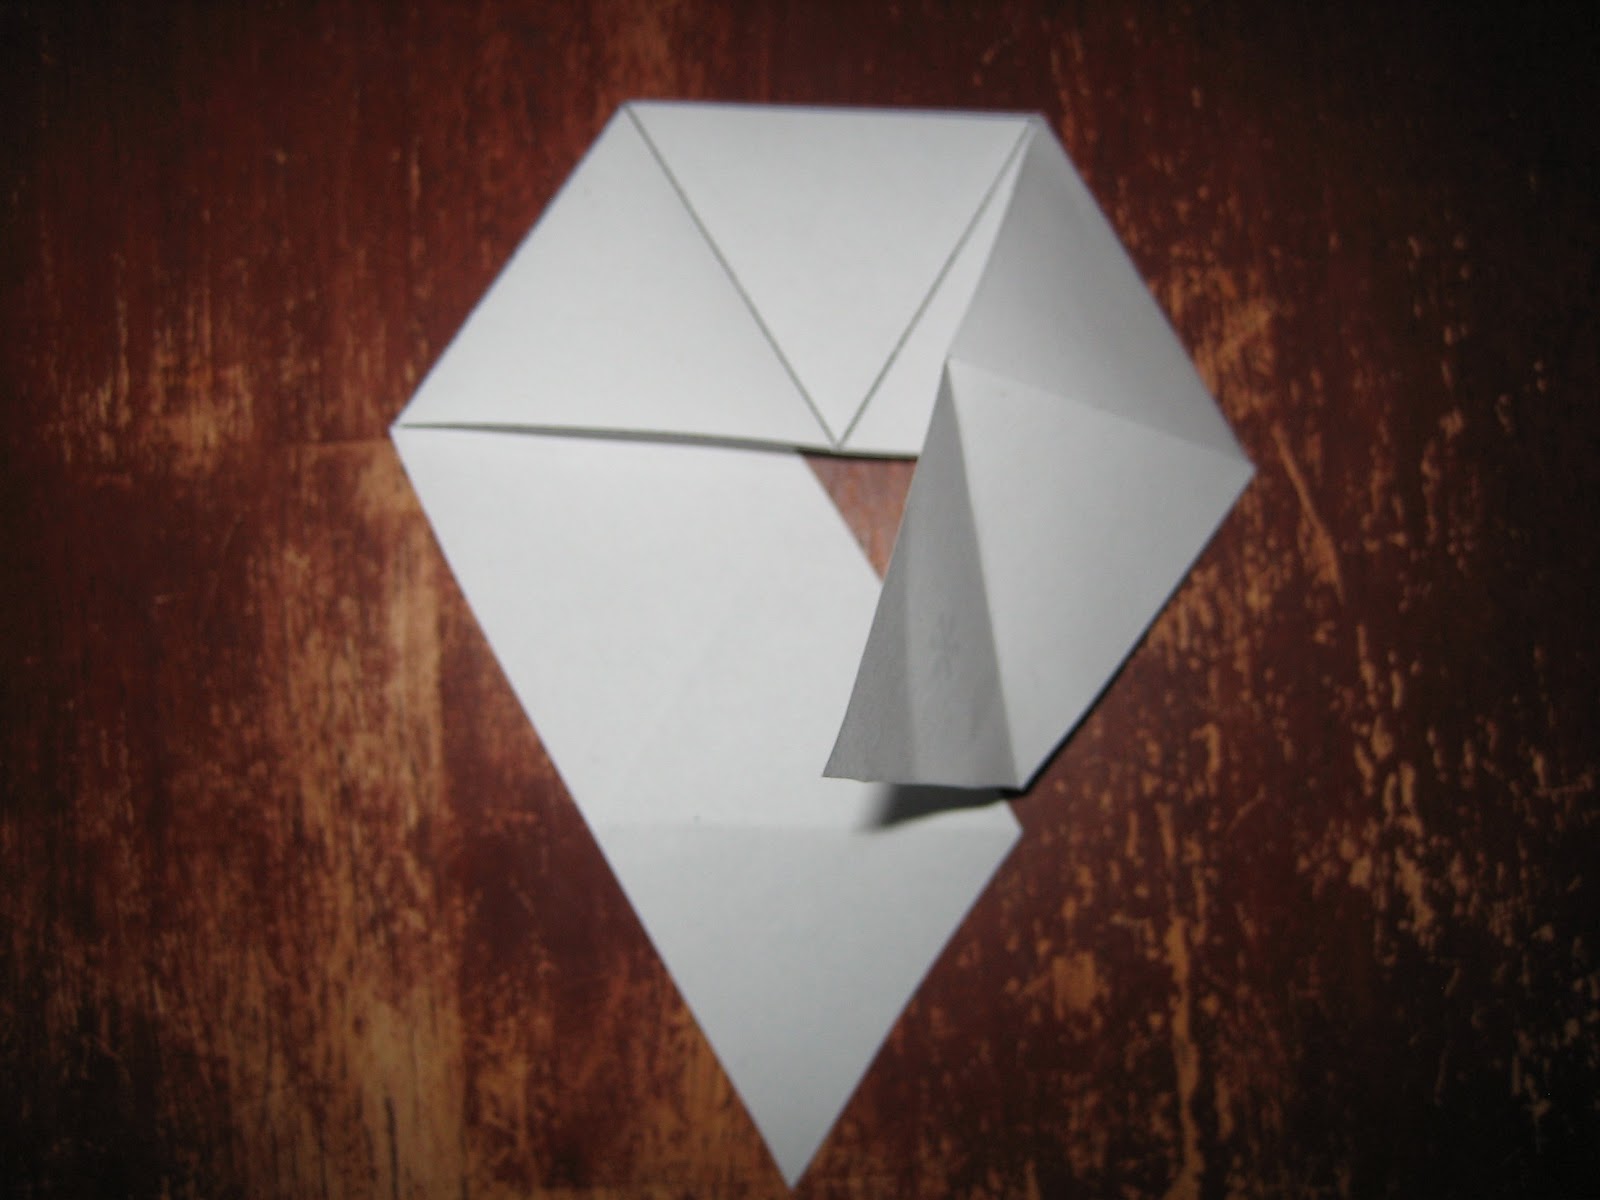
Making trihexaflexagons
Having watched the Vi Hart hexaflexagon videos, Karyn Vogel and I have been talking about including them as a station at C.P. Smith's upcoming Math Night. The limitation of Vi Hart's videos (for me, at least) is that they are inspirational, rather than instructive, so I needed to do some more research to figure out how we could make our own flexagons. The problem is that while there are a lot of sites out there, most of the instructions are a little lacking. As Karyn notes in her blog, one of the best sites for pre-made patterns is the Flexagons page of Aunt Annie's crafts, but even with the pre-made pattern, the instructions are a little lacking.
So, I'm going to give it a try:


So, I'm going to give it a try:
- The following is an adaptation of Annie's basic black & white pattern. You can get a printable copy here. This removes the need to double and paste (Step 4).

- As with Annie's site, you fold back and forth on all the solid lines.

- It's the next step where Annie lost me. So what you do is make a valley fold (i.e., fold towards you) along the marked line.

- Next, make a mountain fold (i.e., away from you) along the marked line.
- As part of the mountain fold, the piece that has just been mountain folded should end up on top of the piece that was valley folded.

- It should now look like this.

- Flip the paper over (left to right or right to left). If you plan to use paste, then put paste on the triangles that have the asterisks and fold them together. If you plan to use tape, then cut along the marked line and tape the remaining triangle with the asterisk to the edge you just cut.

- It's now ready to flex.

Re-reading Karyn's post, I realize it's not entirely obvious exactly how to flex the flexagon. Maybe that's another post.
Thursday, October 21, 2010
The fight against innumeracy
The Vermont News Guy is in my Reader on a trial basis, and so far I'm fairly happy. And I should love his post on Numbers and Words, but unfortunately while railing against innumeracy, he commits the crime himself. Sigh. To wit, the problematic portion of the post says:
Vermonters between the ages of five and 17 had almost the same poverty rate (10.6 percent) as the entire population, but the rate for children under five was a surprisingly high 16.2 percent. Even that was lower than in most other states. In Mississippi, more than 30 percent of children under five were poor.
Unlike most states in the deep South, Texas, New Mexico, Arizona, and both Dakotas, no county in Vermont had a poverty rate of anywhere close to 30 percent. Still, there were obvious – and perhaps not surprising – differences among the state’s 14 counties. The lowest rate was Grand Isle County’s 8.4 percent; the highest Essex County’s 14.8 percent.
The rates in the rest of the state were as follows: Addison 10.4; Bennington 12.2; Caledonia 11.8; Chittenden 9.6; Franklin 9,9; Lamoille 10.1; Orange 10.9; Orleans 14.3; Rutland 11.6; Washington 9.7; Windham 9.8; Windsor 9.3.When he notes that no county in Vermont had a poverty rate close to 30 percent, that 30 percent benchmark is set by the percentage of children under five in poverty in Mississippi. For the state of VT, the poverty rate for children under five is 16.2, but then he lists the poverty rate for all people, instead of the rate for children under five, by county. What he wants to look at are the by-county poverty rates for children under 5.
Wednesday, August 19, 2009
Counting change
Dinesh recently turned in 13 years of accreted change to the bank, and offered friends the chance to guess how much 121 pounds of change was worth. How could I resist?
To start, I collected pennies for 20+ years and had about 120lbs of them when turned in to the bank in 2001. It was north of 20,000 pennies, so without thinking more about it, I would have guessed about $2000 in Dinesh's change bank. Why that number? Because if 120lbs is roughly 20,000 coins and each occurs with equal probability, then the average value of each coin is (1+5+10+25)/4 = 10.25 cents, or about 10 times more than the $200 of pennies I'd collected.
However, the weights vary by type of coin, with averages as follows:
- Penny: 2.5g
- Nickel: 5g
- Dime: 2.268g
- Quarter: 5.670g
121lbs = 54884.68g (thank you, Convert!), so even if every single coin was a quarter, the total would come to roughly $2400; if each coin is equally likely, then Dinesh's change bank is worth $1457.62.
So, let's think a little more (but only a little!) about this. Maybe assuming that each type of coin is equally likely isn't a good assumption. Maybe we should assume that each possible amount of change from $0.01 to $0.99 is equally likely. In that case, approximately 31.9% of the coins are quarters, 17.0% are dimes, 8.5% are nickels, and 42.6% are pennies. Using this distribution of coins, the value of the change bank is $1324.37 (crude R code below to reproduce this). So that's what I guessed.
quarters <- 0
dimes <- 0
nickels <- 0
pennies <-0
for (i in 1:99) {
change <- i
quarters <- quarters + change%/%25
change <- change%%25
dimes <- dimes + change%/%10
change <- change%%10
nickels <- nickels + change%/%5
pennies <- pennies + change%%5
}
54884.68 * (.25 * quarters / 5.67 + .1 * dimes / 2.268 + .05 * nickels / 5 + .01 * pennies / 2.5) / (quarters + dimes + nickels + pennies)
Subscribe to:
Posts (Atom)